Lafayette CollegeTechnology Help
Utilizing Video Analytics with Kaltura
Kaltura Analytics
From the Analytics page, you can access data related to the media in a given course for a specific time period.
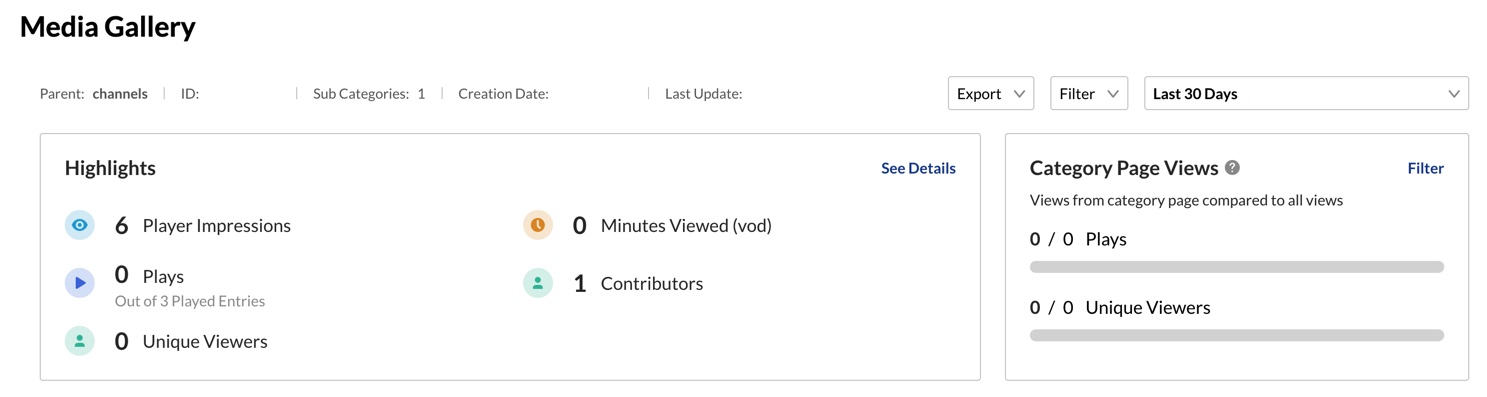
- Highlights
- Displays a snapshot of the important metrics for the selected timeframe.
- User Engagement
- This data provides a list of all users in the course, and some specific viewership data for each user, including the number of unique videos watched, the number of views, average view time, average drop-off time (for each user, across all media), and number of plays.
- Metrics Over Time
- A graph containing the user engagement data over time. Data can be viewed monthly or daily.
- To see detailed data, hover over any point in the graph. You can also click on “View Details” to see a table of all the metrics as well as compare other metrics from the drop-down list.
- Media Engagement
- This data provides a list of all contributors of media to the course.
- If you created your own media for the course, it is likely that there will not be any relevant data in this tab for you to use.
- Top Countries
- Displays the geographical distribution by plays using a heatmap as well as a table ranking the countries from most plays to least.
- You can drill down to cities by selecting a country on the map or from the table.
- Devices Overview
- Here you can see which device viewers used to watch the video.
- Top Domains
- Displays the top domains including user metrics that had the most number of plays in the selected timeframe.
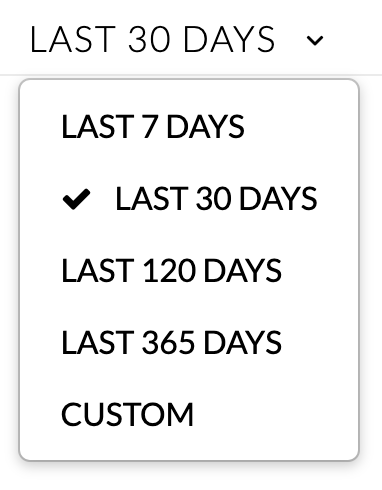
- Time Frame
- Using the dropdown menu, you can change the time frame for which you wish to see analytics.
- The default setting will show the analytics for the last 30 days.
Analytics Reporting
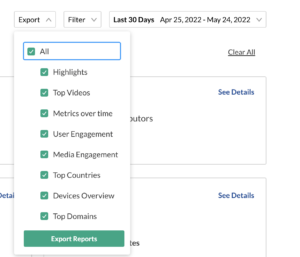
All analytics tabs have the option to Export to a CSV file.
- Select the [Export] button in the top right of the analytics dashboard.
- Select the data you would like to export.
- Click [Export Reports].
- A notification is sent about the export request status. If the data in the report was filtered, the report is based on the filter applied. You will be notified that your export request is being processed and will be emailed to you when completed. If you receive an error, break down your report into smaller time frames or use filters to reduce the size of the report. Please note: the files expire in 7 days.