Lafayette CollegeTechnology Help
Creating Accessible Excel Documents
Creating Excel workbooks and and charts with accessibility in mind allows for content that is accessible to all users and more readily understandable to those using assistive technology such as screen readers. Use the following tips and best practices to make Excel documents as accessible as possible.
Spreadsheet Structure
Tables
The most important practice to ensure accessibility is to use a simple table structure with specific column header information. Screen readers keep track of their location in a table through the counting of table cells and will run into problems if there are split or merged cells, or if a table is nested within another table. Blank cells are also problematic because they may cause a screen reader to think a table is empty beyond that point. Header information is used to identify rows and columns for the user and gives a clear way to understand the relationship of the information in the table.
Headers
Using headers allows those using screen readers to navigate content more easily and to discern the significance of that content.
Add headers to a new table
- Select the cells you want to include in the table
- On the Insert tab in the ribbon, select Table
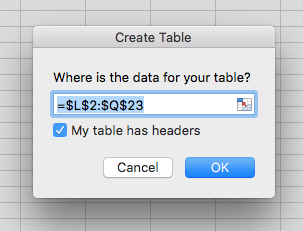
- Select the My table has headers check box and select [OK]
- Type new, descriptive names for each column in the table

Add headers to an existing table
- Position the cursor where you would like the header row to be in the table
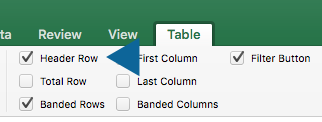
- On the Table tab in the ribbon, select the Header Row check box
- Type in the desired column headings

Sheet Tabs
Screen readers use sheet names to give the user information about what is found on each worksheet as a way to provide navigation and understanding of the content of the sheet. To assist in this navigation, give all sheet tabs unique names and remove blank sheets.
To rename a sheet tab
- Right-click the desired sheet tab and select Rename
- Type a brief, unique name for the sheet
Spreadsheet Content
Visuals and Tables
Alt text is a way to provide those using screen readers information about visuals, tables, etc. that they may not be able to access visually. Alt text is a brief description of the content of the visual, table, etc. that is read to the user.
Add alt text to visuals
The following steps provide instruction for adding alt text to images, graphs, SmartArt and PivotCharts:
- Right-click the visual, select “Edit Alt Text…”
- Type the alt text in the Description field along with a title.
- It is recommended to keep alt text to 125 characters or fewer as most screen readers break text up into blocks of 125 characters. For especially complex charts or equations, a link to an extended text description should be used.
Add alt text to tables
The following steps provide instruction for adding alt text to tables:
- Right click the table
- Select Table > Alternative Text
- Type the alt text in the Description field as well as a title.
Accessibility Checker
Steps for using the Accessibility Checker are the same as for Word Documents.